Degradation of C
The SCB protein (C) degrades.
Contents
Chemical equation

Rate equation
![r= d_{C}\cdot[C]](/wiki/images/math/f/c/b/fcb71209c990f6af04af87f99fed6a0f.png)
Parameters
The parameter of this reaction is the degradation rate of C ( ). The parameter values were derived from measurements and estimations of autoinducer degradation rates from other bacteria (AHL, PAI2).
| Name | Value | Units | Value in previous GBL models [1] [2] | Remarks-Reference |
|---|---|---|---|---|

|
 [3] [4] [5] [6] [3] [4] [5] [6]
|

|

Range tested:
( Bistability range: ( and (
|
Chen et al. empirically calculated the degradation rate of the autoinducer PAI2 in Pseudomonas aeruginosa cultures and reported a best-fit degradation constant of  . .
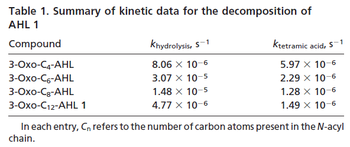
 Chen et al. 2005[4] Additionally, the degradation rates of the quorum sensing autoinducer AHL have been measured in vitro by Kaufmann et al. and the reported rates for different AHLs are between With regards to SCBs in particular, according to a review by E. Takano these molecules are very stable and can be still detected after more than 12h into stationary phase.  E. Takano 2006[3] Therefore, we can assume that the degradation rate of SCB is slower than the ones reported for other autoinducers and will not exceed the value |
Parameters with uncertainty
When deciding how to describe the uncertainty for this parameter we must take into consideration that the reported values are either calculated or estimated based on in vitro and in vivo experiments in different bacteria species. Additionally, the values correspond to various autoinducers but not to SCBs. This means that there might be a notable difference between actual parameter values and the ones reported in literature. However, from the published information we can safely assume that SCBs are very stable molecules and their degradation rate will not exceed the maximum rate published for the other autoinducers. These facts influence the quantification of the parameter uncertainty and therefore the shape of the corresponding distribution. By assigning the appropriate weights to the parameter values and using the method described here, the appropriate probability distribution was designed.
Thus, the weight of the distribution is put to  which is set as the mode of the log-normal distribution for the
  and the Spread is
  , so the range where 68.27% of the values are found is between
  and
and  . Thus, it will be possible to also explore potentially slower degradation rates.
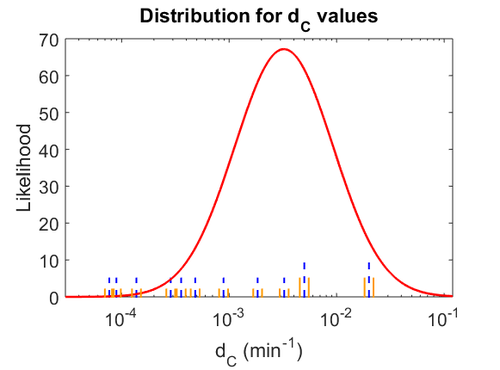
The probability distribution for the parameter, adjusted accordingly in order to reflect the above values, is the following:
The values retrieved from literature and their weights are indicated by the blue dashed lines, and the uncertainty for each value is indicated using a default value of 10% error (orange lines).
The parameter information of the distribution is:
| Parameter | Mode | Spread | μ | σ |
|---|---|---|---|---|

|

|

|

|

|
References
- ↑ 1.0 1.1 1.2 S. Mehra, S. Charaniya, E. Takano, and W.-S. Hu. A bistable gene switch for antibiotic biosynthesis: The butyrolactone regulon in streptomyces coelicolor. PLoS ONE, 3(7), 2008.
- ↑ 2.0 2.1 2.2 A. Chatterjee, L. Drews, S. Mehra, E. Takano, Y.N. Kaznessis, and W.-S. Hu. Convergent transcription in the butyrolactone regulon in streptomyces coelicolor confers a bistable genetic switch for antibiotic biosynthesis. PLoS ONE, 6(7), 2011.
- ↑ 3.0 3.1 E. Takano. γ-butyrolactones: Streptomyces signalling molecules regulating antibiotic production and differentiation. Current Opinion in Microbiology, 9(3):287–294, 2006.
- ↑ 4.0 4.1 Chen CC., Riadi L., Suh S.J., Ohman D.E., Ju L.K. Degradation and synthesis kinetics of quorum-sensing autoinducer in Pseudomonas aeruginosa cultivation. J Biotechnol. 2005;117(1):1-10.
- ↑ 5.0 5.1 Weber M., Buceta J. Noise regulation by quorum sensing in low mRNA copy number systems. BMC Systems Biology 2011, 5:11
- ↑ 6.0 6.1 Kaufmann GF, Sartorio R, Lee SH, Rogers CJ, Meijler MM, Moss JA, Clapham B, Brogan AP, Dickerson TJ, Janda KD. Revisiting quorum sensing: Discovery of additional chemical and biological functions for 3-oxo-N-acylhomoserine lactones. Proc Natl Acad Sci U S A. 2005;102(2):309-14.


 )
)

 )
)


 )
)

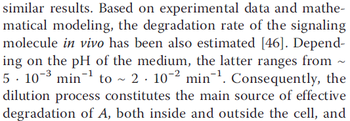
 . Weber et al. also reported that the degradation rate of AHL in vivo has been estimated, and is within the range
  .
.


 .
.
