Binding of R2 to OA operator
The ScbR homo-dimer (R2) binds to the ScbA gene operator (OA) and represses its mRNA transcription. As reported by Bhukya et al. [1] two ScbR homo-dimers can bind to the promoter. When one homo-dimer is bound, the mRNA transcription is already being repressed. As the concentration of ScbR rises, a second homo-dimer may bind to the already suppressed promoter and further enhance the suppression of the transcription. Therefore, this behaviour is represented by two separate reactions that may take place in different times.


Contents
Chemical equation


Rate equation
![r1= \frac{k^{-}_{2}}{K_{d2}}\cdot [O_{A}]\cdot [R_{2}] - k^{-}_{2}\cdot [O_{A}-R_{2}]](/wiki/images/math/f/7/c/f7c27c3558980d2f6053ec960e7d8804.png)
![r2= \frac{k^{-}_{8}}{K_{d8}}\cdot [O_{A}-R_{2}]\cdot [R_{2}] - k^{-}_{8}\cdot [O_{A}-2R_{2}]](/wiki/images/math/6/0/2/602697513ed4762480c452ee15dc870a.png)
Parameters
The parameters of this reaction are the dissociation constant for binding of ScbR to OA ( and
and  ) and the dissociation rate for binding of ScbR to OA (
 and
and  ). and will have the same distributions, as they refer to a similar binding process and by taking uncertainty into account, the range of parameter values can be considered the same. The same applies for and . ScbR is a member of the TetR family of repressors, named after the member of this group which is the most completely characterized, the TetR repressor protein. TetR binds to the operator tetO, repressing its own expression and that of the efflux determinant tetA in a similar way as ScbR binding to OR and OA and repressing its own expression and the expression of ScbA. Therefore parameter values were derived from published data on the TetR-tetO interaction and on tetR-like proteins binding to their corresponding operators.
| Name | Value | Units | Value in previous GBL models [2] [3] | Remarks-Reference |
|---|---|---|---|---|
|
|
 [4] [5] [6] [7] [4] [5] [6] [7]
|

|

(Range tested: (Bistability range: |
An early publication based on stopped-flow measurements at various salt concentrations reports a KA of  [4], therefore a Kd ( [4], therefore a Kd ( ) of ) of  . The Tet repressor and TetO operator were derived by using an overproducing E. coli strain. . The Tet repressor and TetO operator were derived by using an overproducing E. coli strain.
 Kleinschmidt et al. 1988[4] Data derived from equilibrium SPR analysis of TetR-tetO interaction report a Ka of  Kamionka et al. 2004 [5] Additionally, a study on the TetR-like protein Rv3066 binding to the mmr operon in M. tuberculosis suggests a Kd of  Bolla et al. 2012 [6] Finally, in vitro studies on TetR-like protein ActR in S. coelicolor suggest a Kd in the range of  Ahn et al. 2007 [7] |
|
|
 [4] [8] [4] [8]
|

|
N/A | According to the study by Kleinschmidt et al.[4] mentioned above, the maximal association rate constant was  . By taking into account the equilibrium association constant reported above ( . By taking into account the equilibrium association constant reported above ( ), the dissociation rate constant can be calculated as per ), the dissociation rate constant can be calculated as per 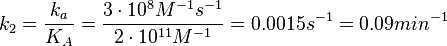 . .
 Kleinschmidt et al. 1988[4] Additionally, a study on a TetR-like protein (RolR) which binds to its operator rolO and blocks the transcription of rolHMD and of its own gene, in Corynebacterium glutamicum (Gram positive and GC content ~ 50-60% bacteria) reports the dissociation rates  Li et al. 2012[8] As less information was available for |
 )
)
 )
)
 . E. coli was used as a host for the expression of proteins and the experiments were conducted with synthetic tetO-containing fragments.
 .
. and
and 
Parameters with uncertainty
When deciding how to describe the uncertainty for each parameter there are a few points to be taken into consideration. Firstly, the values reported in literature are spread in a relatively large range and correspond to different protein-operator binding reactions, although all are part of the same family of repressors (TetR). Additionally, the values were acquired by in vitro testing, although in some of the publications a strong correlation between in vitro and in vivo measurements is noted. This means that there might be a notable difference between actual parameter values and the ones reported in literature. These facts influence the weight assigned to each parameter value, the quantification of the parameter uncertainty and therefore the shape of the corresponding distributions. Therefore, by assigning the appropriate weights to the parameter values and using the method described here, the appropriate probability distributions were designed.
More specifically, with regards to the , the value that is considered as the most accurate in different publications is measured by Kleinschmidt et al. However, the Kd s measured for the ActR protein in S. coelicolor cover the range of  . Therefore, the mode of the log-normal distribution calculated for the is
  which is within the range of the values reported for S. coelicolor and the Spread is
  in order to be able to explore a wide range of values and thus take into account the uncertainty caused by both the in vitro testing and the measurements in different species and proteins. Thus, the range where 68.27% of the values are found is between 0.044 and 2.048 nM.
Similarly, the value calculated for the by the measurements of Kleinschmidt et al. is  , however other studies reported values of up to
  . After considering all the factors and assigning the relevant weights to the parameter values, the mode of the log-normal distribution calculated for was
  and the Spread was
  . This means that the range where 68.27% of the values are found is between 0.247 and 0.968 .
Since the two parameters are interdependent, thermodynamic consistency also needs to be taken into account. This is achieved by creating a bivariate system as described here. Since  is the parameter with the largest geometric coefficient of variation, as only one reported value was retrieved from literature, this is set as the dependent parameter as per:
  . The location and scale parameters of (μ=-0.53113 and σ=1.3034) were calculated from those of and .
The probability distributions for the two parameters, adjusted accordingly in order to reflect the above values, are the following:


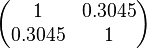
The values retrieved from literature and their weights are indicated by the blue dashed lines, and the uncertainty for each value is indicated using the reported experimental error (green lines) or a default value of 10% error (orange lines). The correlation matrix which is necessary to define the relationship between the two marginal distributions (,) of the bivariate system is derived by employing random values generated by the two distributions.
The parameter information of the distributions of the multivariate system is:
| Parameter | Mode | Spread | μ | σ | Correlation matrix |
|---|---|---|---|---|---|
|
|

|
|

|

|
N/A |
|
|

|
|

|

|
|
|
|
N/A | N/A | 
|

|
The multivariate system of the normal distributions ( and
and  ) and the resulting samples of values are presented in the following figure:

In this way, a system of distributions is created where each distribution is described and constrained by the other two. Therefore, the parameters will be sampled by the two marginal distributions in a way consistent with our beliefs and with the relevant thermodynamic constraints. However, since the model's reaction rate requires the parameters and , and not the , the value for is calculated by the parameters sampled from the other two distributions in an additional step, as per  .
All the above apply as well for the parameters and .
.
All the above apply as well for the parameters and .
References
- ↑ Bhukya H, Bhujbalrao R, Bitra A, Anand R. "Structural and functional basis of transcriptional regulation by TetR family protein CprB from S. coelicolor A3(2)." Nucleic Acids Research. 2014;42(15):10122-10133.
- ↑ S. Mehra, S. Charaniya, E. Takano, and W.-S. Hu. A bistable gene switch for antibiotic biosynthesis: The butyrolactone regulon in streptomyces coelicolor. PLoS ONE, 3(7), 2008.
- ↑ A. Chatterjee, L. Drews, S. Mehra, E. Takano, Y.N. Kaznessis, and W.-S. Hu. Convergent transcription in the butyrolactone regulon in streptomyces coelicolor confers a bistable genetic switch for antibiotic biosynthesis. PLoS ONE, 6(7), 2011.
- ↑ 4.0 4.1 4.2 4.3 4.4 4.5 Kleinschmidt C., Tovar K., Hillen W., Porschke D. Dynamics of repressor-operator recognition: Tn10-encoded tetracycline resistance control. Biochemistry, 1988, 27(4), pp. 1094–1104.
- ↑ 5.0 5.1 5.2 Kamionka A, Bogdanska-Urbaniak J, Scholz O, Hillen W. Two mutations in the tetracycline repressor change the inducer anhydrotetracycline to a corepressor. Nucleic Acids Research. 2004;32(2):842-847.
- ↑ 6.0 6.1 6.2 Bolla JR, Do SV, Long F, et al. Structural and functional analysis of the transcriptional regulator Rv3066 of Mycobacterium tuberculosis. Nucleic Acids Research. 2012;40(18):9340-9355.
- ↑ 7.0 7.1 7.2 Ahn SK, Tahlan K, Yu Z, Nodwell J. Investigation of Transcription Repression and Small-Molecule Responsiveness by TetR-Like Transcription Factors Using a Heterologous Escherichia coli-Based Assay. Journal of Bacteriology. 2007;189(18):6655-6664.
- ↑ 8.0 8.1 8.2 Li T, Zhao K, Huang Y, et al. The TetR-Type Transcriptional Repressor RolR from Corynebacterium glutamicum Regulates Resorcinol Catabolism by Binding to a Unique Operator, rolO. Applied and Environmental Microbiology. 2012;78(17):6009-6016.