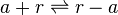
Antisense interaction between r and a
The full length mRNA of scbR (r) binds to the full length mRNA of scbA (a) and form a complex which prevents further translation of both mRNAs.


Contents
Chemical equation
Rate equation
![r= \frac{ k^{-}_{ar}}{K_{ar}}\cdot [r]\cdot [a]-k^{-}_{ar} \cdot [r-a]](/wiki/images/math/0/c/3/0c361c1e3617ab1a9eab319721c9411c.png)
Parameters
The parameters of this reaction is the binding and unbinding rate constant for the interaction of scbR mRNA with scbA mRNA ( ) and (
 ). The parameter values are derived from various RNA/RNA interaction studies in bacteria.
| Name | Value | Units | Value in previous GBL model [1] | Remarks-Reference |
|---|---|---|---|---|
|
|
 [2] [3] [4] [5] [6] [2] [3] [4] [5] [6]
|

|
Bistability range: ( |
In a 1991 review, Y. Eguchi reported association rates for double stranded RNA binding in the range of   . A similar range (~ . A similar range (~ ) is published by S. Brantl in a 2007 review on regulatory mechanisms employed by antisense RNAs. ) is published by S. Brantl in a 2007 review on regulatory mechanisms employed by antisense RNAs.
These values are also in agreement with an in vitro study by Franch et al. on the effect of a U-turn loop structure in RNA/RNA interactions, which employed E. coli hok-RNAs and Sok-RNAs. The study reported binding rate constants Furthermore, Nordgren et al. published a study on the kinetics of antisense RNA interactions by using Surface Plasmon Resonance (in wild-type and mutant RNA pairs), where the values reported for the association rate constants are in the range of  Nordgren et al. 2001[6] Finally, Lima et al. (see table below) in a study measuring kinetics on synthetic oligonucleotides, reported a range of association constants between Therefore, the overall range of values for the association rate |
|
|
 [6] [7] [6] [7]
|

|
 [1] [1]
Bistability range: ( |
In the study by Nordgren et al., dissociation rate constants in the range  were reported (see figure above). These values are also consistent with the ones published by Lima et al. in a study on antisense oligonucleotide hybridization kinetics, who reported dissociation rate constant values in the range were reported (see figure above). These values are also consistent with the ones published by Lima et al. in a study on antisense oligonucleotide hybridization kinetics, who reported dissociation rate constant values in the range 
 Lima et al. 2001[7] Although the values retrieved by literature are between |

 )
)


 (
( ) and suggested that ~


 and the resulting equilibrium dissociation constant (calculated from the other parameters and measured by gel shift assay) are in the range of
  (
( ). The experiments measured in vitro the rate of complex formation and in vivo the efficiency of control.
 (
( ).
).
 and for the equilibrium dissociation constant
 )
)
 and
and  , we wish to explore a wider range of values (
 ) in order to take into account the possibility that high GC contents may affect the kinetic rate constants.
Parameters with uncertainty
When deciding how to describe the uncertainty for these parameter we must take into consideration the fact that many of the reported values are derived from in vitro experiments and correspond to mRNA sequences or fragments of different bacteria species. This means that there might be some difference between actual parameter values and the ones reported in literature. These facts influence the quantification of the parameter uncertainty and therefore the shape of the corresponding distribution. Therefore, by assigning the appropriate weights to the parameter values and using the method described here, the appropriate probability distributions were designed.
With regards to the the values that correspond to the wild type RNAs are between  , therefore we put the weight of the distribution in this range and we consider as least likely the larger values as they correspond to mutant RNAs. Therefore, the mode of the log-normal distribution is calculated to be
  and the Spread is
  . Thus the range where 68.27% of the values are found is between
  and
and  .
.
Similarly, the values reported for are within the range  , we put the weight of the distribution within this range but also explore the whole range of values. Therefore, the mode of the log-normal distribution is set to
  and the Spread is
  . Thus the range where 68.27% of the values are found is between
  and
and  .
.
Finally, the probability distribution for  is defined accordingly, in order to allow the exploration of the full range of the values retrieved from literature. Therefore, the mode is set to
  and the Spread is
  . In this way the range where 68.27% of the values are found is between
  and
and  . The initial distribution parameters are μ=-1.3114 and σ=1.3294.
Since the three parameters are interdependent, thermodynamic consistency also needs to be taken into account. This is achieved by creating a bivariate system as described here. Since is the parameter with the largest geometric coefficient of variation, this is set as the dependent parameter as per:  , and an updated probability distribution is defined. The location and scale parameters of (μ=-3.9001 and σ=1.5742) were calculated from those of and .
The probability distributions for the three parameters, adjusted accordingly in order to reflect the above values, are the following:


The values retrieved from literature and their weights are indicated by the blue dashed lines, and the uncertainty for each value is indicated using the reported experimental error (green lines) or a default value of 10% error (orange lines). The correlation matrix which is necessary to define the relationship between the two marginal distributions (,) of the bivariate system is derived by employing random values generated by the two distributions.
The parameter information of the distributions of the multivariate system is:
| Parameter | Mode | Spread | μ | σ | Correlation matrix |
|---|---|---|---|---|---|
|
|

|
|

|

|
N/A |
|
|
N/A | N/A | 
|

|
|
|
|

|
|

|

|
The multivariate system of the normal distributions ( and
and  ) and the resulting samples of values are presented in the following figure:

In this way, a system of distributions is created where each distribution is described and constrained by the other two. Therefore, the parameters will be sampled by the two marginal distributions in a way consistent with our beliefs and with the relevant thermodynamic constraints. However, since the model's reaction rate requires the parameters and , and not the , the value for is calculated by the parameters sampled from the other two distributions in an additional step, as per 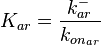 .
.
References
- ↑ 1.0 1.1 1.2 A. Chatterjee, L. Drews, S. Mehra, E. Takano, Y.N. Kaznessis, and W.-S. Hu. Convergent transcription in the butyrolactone regulon in streptomyces coelicolor confers a bistable genetic switch for antibiotic biosynthesis. PLoS ONE, 6(7), 2011.
- ↑ Shokeen S, Johnson CM, Greenfield TJ, Manias DA, Dunny GM, Weaver KE. Structural analysis of the Anti-Q-Qs interaction: RNA-mediated regulation of E. faecalis plasmid pCF10 conjugation. Plasmid. 2010;64(1):26-35.
- ↑ 3.0 3.1 Brantl S. Regulatory mechanisms employed by cis-encoded antisense RNAs. Cell regulation (RNA special issue). 2007; 10: 102–109.
- ↑ 4.0 4.1 Eguchi Y., Itoh T., Tomizawa J. Antisense RNA. Annual Review of Biochemistry. 1991;60: 631–652.
- ↑ 5.0 5.1 5.2 Franch T., Petersen M., Wagner EG., Jacobsen JP., Gerdes K. Antisense RNA regulation in prokaryotes: rapid RNA/RNA interaction facilitated by a general U-turn loop structure. J Mol Biol. 1999 Dec 17;294(5):1115-25.
- ↑ 6.0 6.1 6.2 Nordgren S., Slagter-Jäger J.G., Wagner G.H. Real time kinetic studies of the interaction between folded antisense and target RNAs using surface plasmon resonance. J. Mol. Biol. 2001;310(5):1125-34.
- ↑ 7.0 7.1 Lima W.F., Monia B.P., Ecker D.J., Freier S. M. Implication of RNA structure on antisense oligonucleotide hybridization kinetics. Biochemistry 1992 31 (48), 12055-12061